Philadelphia, otherwise known as the City of Brotherly Love, appears to be exhibiting all of the positives signs of a healthy real estate market in 2016. Despite the median home price for the Philadelphia real estate market residing below the national average during the first quarter, home affordability, employment rates and new housing construction were all up, revealing a bullish outlook.
Boding well for Philadelphia investors are predictions of “good, if not great” job growth in several sectors, including the region’s staples: education and health services, and trade/transportation/utilities. Additionally, Philadelphia’s unemployment rate was on par with the national average, having improved dramatically over the course of a year. At 5.0 percent, the unemployment rate for the Philadelphia area is equal to the national average, but it continues to hold up and is heading in the right direction. Job growth, for the moment, is relatively strong at 2.6 percent in 2016 compared to the national average of 2.0 percent. As it has in cities like Denver and Richmond, the local economy should boost the Philadelphia housing market.
Affordability continues to favor those in the Philadelphia real estate market. While historically strong, home affordability for the Philadelphia housing market reached new heights during the first quarter, improving more than its historical average. In fact, Philadelphia remains more affordable than most markets across the United States. Half way through the year, homeowners in Philadelphia were allocating an average of 7.6 percent of their income to mortgage payments, whereas the rest of the country was spending about 14.5 percent.
A generational shift in locational preferences also looks to favor the direction in which the Philadelphia market is heading; Millennials are displaying a shift in residential preference from suburban to urban communities. The transition has proven instrumental in the rebuilding of Philadelphia’s housing market, as the active participation of first-time homebuyers should stimulate the local economy.
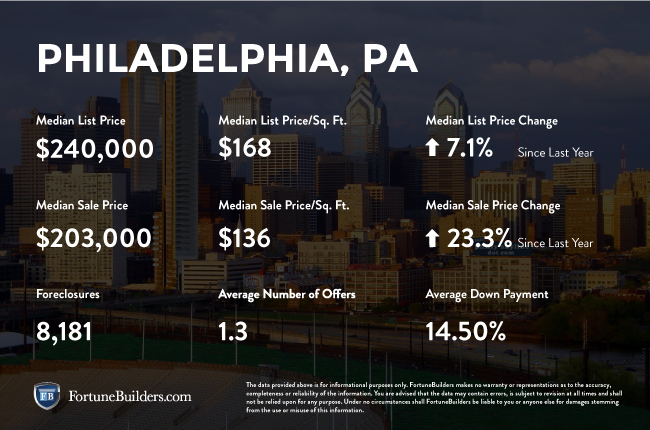
The median home price for the Philadelphia real estate market in the first quarter was $203,900 compared to the national average of $215,767, and below its median home price for the same time period the previous year. However, Philadelphia investors should expect to see home prices increase by as much as 2.9 percent in the next 12 months, according to Zillow.
Philadelphia, PA Real Estate Market Statistics:
According to Trulia, the average Philadelphia home is worth about $157/sq. ft. That price represents an increase of 16 percent over the same period last year. Although gains in the last three years have helped to pull the Philadelphia real estate market out of the post-recession weak prices, home appreciation continues to lag. Over the last three years (12 quarters), houses have appreciated 3.1, percent compared to the national average of 22.6 percent. For a more comprehensive breakdown of equity, refer to the following:
- Homes purchased in the Philadelphia, PA housing market one year ago have appreciated, on average, by $2,439. The national average was $15,781 over the same period.
- Homes purchased in the Philadelphia, PA housing market three years ago have appreciated, on average, by $16,901. The national average was $49,356 over the same period.
- Homes purchased in the Philadelphia, PA housing market five years ago have appreciated, on average, by $20,045. The national average was $68,727 over the same period.
- Homes purchased in the Philadelphia, PA housing market seven years ago have appreciated, on average, by $20,418. The national average was $59,758 over the same period.
- Homes purchased in the Philadelphia, PA housing market nine years ago have appreciated, on average, by $9,642. The national average increased $16,435 over the same period.
Despite declines in home appreciation, the Philadelphia real estate market still has one major factor working in its favor: affordability. That’s right, the Philadelphia housing market is more affordable than most comparable markets in the country despite having appreciation levels below par with the national average. Having said that, the average homeowner in the Philadelphia real estate market has historically spent about 11.5 percent of their income on monthly mortgage payments. That is a stark contrast to the 19.5 percent the rest of the country averages.
The number of homes in Philadelphia in some stage of foreclosure is currently 8,168 properties. For Philadelphia investors, the number of new foreclosure filings by foreclosure type is as follows:
- Auction homes have decreased by 28.2 percent over the past month, and 11.3 percent over the past year.
- Bank owned properties have increased 0.8 percent over the last month, and decreased 8.4 percent over the past year.
The decline in foreclosure activity has been good for homeowners, but not so much for Philadelphia investors. The median sales prices of distressed homes, those that were either short sales or bank-owned homes, decreased 1.5 percent during the first quarter of 2016 from a year ago. Eventually, the combination of a decrease in auction activity and rising distressed property values will benefit the non-distressed home sellers. It’s hard to get properties to appraise for a mortgage that would justify a market price. As the lender-mediated properties draw better prices, you’ll see better “comparables.”
Philadelphia, PA: Real Estate Market Summary:
- Current Median Home Price: $203,900
- 1-Year Appreciation Rate: -0.5%
- 3-Year Appreciation Rate: 3.1%
- Unemployment Rate: 5.0%
- 1-Year Job Growth Rate: 2.6%
- Population: 6,060,000
- Median Household Income: $62,171
Philadelphia, PA: Real Estate Market (2016) — Q1 Updates:
The real estate market in Philadelphia was somewhat hushed during the first quarter of 2016. The median home price is currently below the national average and hovering at $203,900 compared to $215,767, while home appreciation rates are at an irritating -0.5 percent as the national average sits at 6.1 percent. Despite year-over-year price growth, home appreciation for the Philadelphia real estate market swung negative this quarter after growing at the end of 2015.
The good news for Philadelphia investors and homeowners is economic factors such as unemployment and home affordability continue to be advantageous. Affordability in the Philadelphia real estate market was among the lowest in the nation during the first quarter of 2016, with homeowners paying 7.6 percent of their income to monthly mortgage payments compared to the national average of 14.5 percent.
For Philadelphia investors, the first quarter of 2016 saw the number of foreclosure filings drop 14 percent lower than the previous. That represents a 26 percent decline from that same time last year. According to RealtyTrac, the median sales price of a non-distressed home during the first quarter of 2016 was $103,000, while the median sales price of a foreclosure home was $45,000 — 56 percent lower than non-distressed home sales.
Philadelphia, PA: Real Estate Market Review (2015):
The median home price for the Philadelphia real estate market was $204,900 during the first quarter of 2015, while the national average was $203,867. Although not extravagant, home appreciation rates in Philadelphia increased 1.5 percent to $6,150 during Q1 compared to the national average of 6.7 percent or $15,753.
Home affordability in 2015 remained one of Philadelphia’s shining achievements. Homeowners paid 8.0 percent of their income to monthly mortgage payments in 2015 compared to the national average of 14.3 percent. That ratio is improved from its historical average of 11.9 percent, which is still significantly better than the national average at 20.0 percent.
One less than stellar attribute of the Philadelphia real estate market in 2015 was unemployment. The rate of unemployment during 2015 was 5.6 percent compared to the national average of 5.5 percent, which marks a slight decrease from the previous year of 6.7 percent. Whiling lagging, job growth for Philadelphia was 1.3 percent in 2015 compared to the national average of 2.1 percent.
Philadelphia, PA: Real Estate Market Review (2014):
The median home price for the Philadelphia real estate market was approximately $227,200 at the end of 2014. Conversely, the average price on a national level was about $15,000 less. As with almost every other city, the rate in which prices continued to appreciate was up from the previous year. It was this price growth that served to remove Philadelphia from the post-market recession price weakness.
During 2014 homeowners that were fortunate enough to purchase properties in 2005 gained an average of $44,858 in equity. By comparison, that was nearly $40,000 more than the national average. By the end of the year, however, equity gains had favored the rest of the country. Across the U.S., homes purchased within 2014 gained about $12,731 in equity. Comparatively, Philadelphia homeowners gained $3,841 in the same period. Price trends from 2011-2014 undercut the steady post-recession home equity growth despite owners paying down their principle.
New construction was on the rise during 2014, as single-family housing permits increased 1.9 percent from the previous year. The increase was attributed to the local inventory stabilizing. However, foreclosures and short sales still had a strong impact on the amount of available homes for sale during 2014.
According to The Long & Foster Market Minute for Philadelphia, data indicates that there were “1,846 homes newly listed for sale in Philadelphia County in 2014 compared to 1,790 in August 2013, an increase of 3 percent. In August 2014, there were 912 current contracts pending sale compared to 970 a year ago. The number of current contracts is six percent lower than last August.”
According to Trulia, “popular neighborhoods in Philadelphia included Fairmount/Art Museum and Northern Liberties/ Fishtown, with average listing prices of $358,721 and $522,568.”
At the end of 2014, the Philadelphia housing market had approximately 3,610 homes for sale with the number of recently sold homes reaching 11,550 during the year. Low interest rates and a strengthening economy were largely responsible for the fast pace of home sales.
In addition, favorable conditions essentially reduced the amount of time homes sat on the market. For the duration of 2014, homes averaged 78 days on the market. Compared to the previous year, that number represents a 5 day drop-off. Inventory also declined to 42,859 properties compared with 45,110 in 2013.
However, while the amount of time homes are lasting on the market has decreased, overall sales were nominally down by 0.6 percent.
During 2014, approximately 7,184 homes in the Philadelphia housing market faced foreclosure, or have already been subjected to some stage of delinquency, according to RealtyTrac. At the beginning of the year, the number of properties that received a foreclosure filing in Philadelphia was 17 percent lower than the previous month and 16 higher higher than the same time last year. Foreclosures in 2014 were actually selling for $37,300 less than non-distressed properties, or 38.5 percent. Making up 47.9 percent of the current market, pre-foreclosures were actually down in 2014 compared to the same period the previous year. Auction properties made up the second largest group of foreclosures at 39 percent, and bank owned foreclosures rounded it out at 13.1 percent.
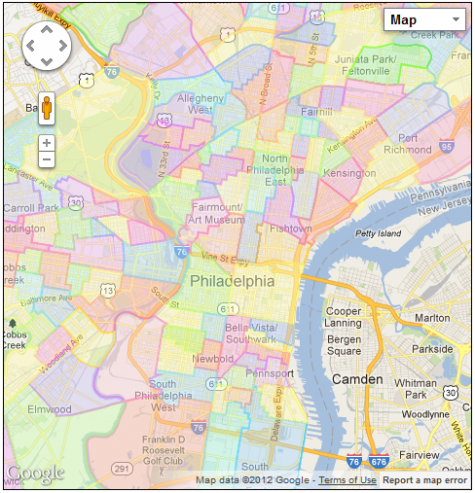
Philadelphia, PA Real Estate Map: